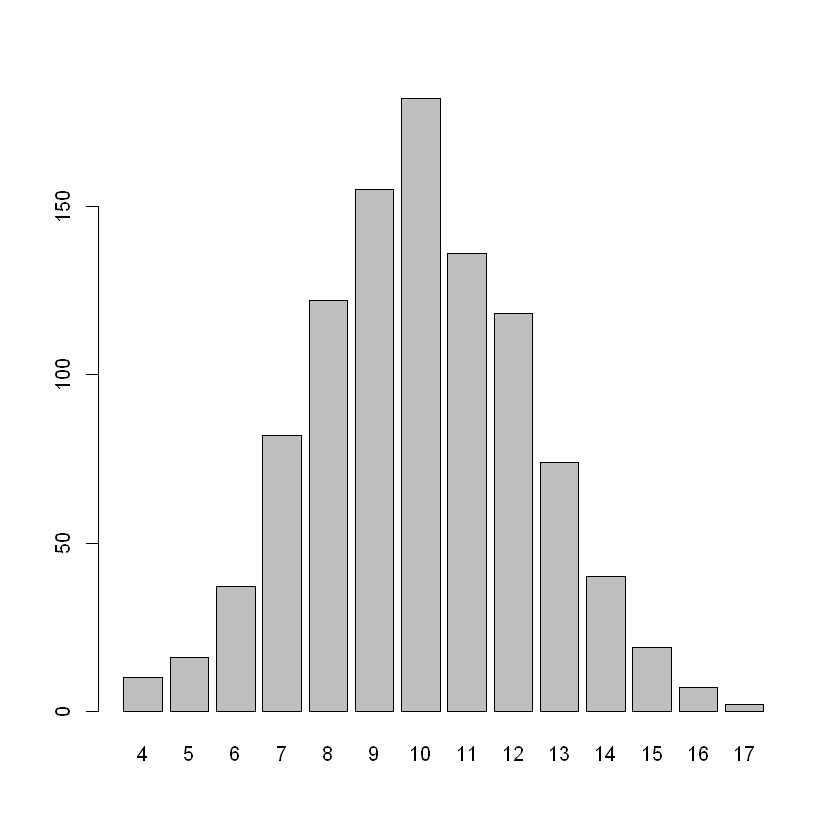
barplot(table(rbinom(1000, 20, 1/2)))
source("help.r")
n <- 50
data <- data.frame(sexo = sample(c("mujer","hombre"),n, replace = T),  resp = sample(c("si","no"),n, replace = T) )